Services Inflation Spiked to Second Highest in 4 Decades, Would Have Spiked to Highest, If Not Slowed by Biggest-Ever Mega-Adjustment of Health Insurance CPI | Wolf Street
But there won’t be an adjustment for the Fed-favored “core PCE” price index that will come out before the next Fed meeting.
By Wolf Richter for WOLF STREET.
Let’s just start with inflation in services today because nearly two-thirds of consumer spending ends up in services, so this is the biggie. And some extra-special stuff happened in the CPI for services in October. What would come today was discussed over the past weeks in the Wall Street Journal and elsewhere, and it wasn’t a surprise: a massive mega-adjustment by the Bureau of Labor Statistics in the CPI for health insurance. And today it came.
Everyone knows that the costs of health insurance didn’t plunge in October from September. But because of the periodic adjustment, the CPI for health insurance plunged 4.0% in October from September, a 6.1 percentage-point swing from September (+2.1%), according to data from the Bureau of Labor Statistics today. This was by far the biggest month-to-month plunge in the BLS data going back to 2005, and far outstripped the adjustments in prior periods:
The CPI for health insurance accounts for 0.9% in overall CPI and for 1.1% in the Core CPI. And the plunge today pushed down the overall index, and even more the core CPI and the services CPI.
Inflation in health insurance is difficult to figure because numerous factors change, not just the premium but also co-pays, deductibles, out-of-pocket maximums, what is covered and what isn’t covered, etc., and there are all kinds of insurance plans out there.
So the BLS uses a different method to estimate price changes, the “retained earnings method,” which the BLS explains here, and once a year or so, it has to adjust the index as more data become available.
Normally the annual adjustment isn’t such a huge deal, but this time, the adjustment was gigantic.
The adjustment will carry forward for the next 12 months, meaning that health insurance CPI will be negative on a month-to-month basis for the next 12 months to work down the overstatement for the past 12 months.
Year-over-year, the health insurance CPI was still up 20.6%, but the year-over-year increases will be slashed for the next 11 months. It was also negative from month-to-month from August 2020 through August 2021.
This chart shows the index value, which will continue to drop for another 11 months, until the next adjustment:
But no adjustment for the Fed’s favored “core PCE” index.
The Fed uses the “core PCE” price index as yardstick for its 2% inflation target. This “core PCE” price index uses a different and broader methodology, and it’s put together by a different government agency (the Bureau of Economic Analysis), and it figures health insurance inflation differently, and there will not be an adjustment.
It’s the lowest lowball index that the government produces, and we may pooh-pooh it, but it’s the most important inflation index for the Fed, and this “core PCE” price index won’t be adjusted in October. It will be released on December 1, just ahead of the Fed’s next meeting.
Services Inflation.
The CPI for services jumped by 0.4% in October from September, less steep than the 0.8% spike in the prior month, thanks to the massive adjustment to health insurance CPI.
In this chart of month-to-month changes of the CPI for services, note the large ups and downs from month to month, which is why you cannot conclude anything by just looking at one month:
On a year-over-year basis, the services CPI jumped by 7.24%, just a tiny bit less than in September (+7.38%). Both are the worst since August 1982.
Without the health insurance adjustment, the year-over-year spike in October would have set a new four-decade record.
Services CPI by category.
The table shows the major services CPI categories in order of the month-to-month change, from the biggest increase (hotels & motels) to the biggest decline (health insurance). More on the housing CPIs Rent and Owner’s Equivalent of rent in a moment:
| Hotels & motels | 5.6% | 6.4% |
| Postage & delivery services | 3.6% | 4.2% |
| Motor vehicle insurance | 1.7% | 12.9% |
| Admission to movies, concerts, sports events | 0.8% | -1.9% |
| Rent of primary residence | 0.7% | 7.5% |
| Motor vehicle maintenance & repair | 0.7% | 10.3% |
| Video and audio services, cable | 0.7% | 3.2% |
| Owner’s equivalent of rent | 0.6% | 6.9% |
| Other personal services (dry-cleaning, haircuts, legal services…) | 0.4% | 5.8% |
| Pet services, including veterinary | 0.2% | 10.7% |
| Water, sewer, trash collection services | 0.0% | 4.8% |
| Telephone services | -0.1% | -0.6% |
| Car and truck rental | -0.5% | -3.5% |
| Medical care services | -0.6% | 5.4% |
| Airline fares | -1.1% | 42.9% |
| Health insurance | -4.0% | 20.6% |
“Core CPI”
The core CPI, which excludes the volatile food and energy products, rose 0.3% in October from September, less bad than the 0.6% spike in the prior month, thanks in part to the massive insurance adjustment.
Year-over-year, core CPI jumped 6.3%, along with several other months this year, the worst since 1982.
Overall CPI.
The all-items CPI rose 0.4% in October from September, same as in the prior month, and by 7.7% year-over-year, a deceleration from October.
Food inflation.
The CPI for “food at home” – food bought at stores and markets – jumped by 0.6% in October from September. Prices in some categories that had spiked wildly are now dipping on a month-to-month basis, such as beef. But others, such as eggs, are re-spiking. The game of inflation Whac-A-Mole
Year-over-year, the CPI for food at home jumped by 10.9%, less terrible than the 13% jump in September.
| Food inflation | MoM | YoY |
| Eggs | 10.1% | 43.0% |
| Fats and oils | 2.1% | 23.4% |
| Baby food | 1.8% | 10.9% |
| Coffee | 1.2% | 14.8% |
| Cereals and cereal products | 0.8% | 15.9% |
| Juices and nonalcoholic drinks | 0.5% | 12.7% |
| Alcoholic beverages at home | 0.5% | 3.8% |
| Overall food at home | 0.4% | 12.4% |
| Fish and seafood | 0.0% | 7.4% |
| Beef and veal | -0.1% | -3.6% |
| Dairy and related products | -0.1% | 15.5% |
| Fresh vegetables | -0.5% | 8.3% |
| Pork | -0.6% | 4.0% |
| Poultry | -1.1% | 14.9% |
| Fresh fruits | -2.4% | 6.6% |
The CPI for “Food away from home”– restaurants, vending machines, cafeterias, sandwich shops, etc. – spiked by 0.9% in October from September, and by 8.6% year-over-year, the worst since 1981.
Energy takes off again.
After the decline in September, the CPI for energy products and services rose 1.8% in October from September, on rising gasoline prices and spiking heating oil prices. Year-over-year, the energy CPI jumped 17.6%:
| Energy | MoM | YoY |
| Overall Energy CPI | 1.8% | 17.6% |
| Gasoline | 4.0% | 17.5% |
| Utility natural gas to home | -4.6% | 20.0% |
| Electricity service | 0.1% | 14.1% |
| Heating oil, propane, kerosene, firewood | 10.5% | 44.2% |
Housing costs spike.
The CPI for “rent of shelter,” which accounts for 32.3% of total CPI, tracks housing costs as a service, not as an investment asset. Its major components:
“Rent of primary residence” (accounts for 7.4% of total CPI) jumped by 0.7% in October from September. Year-over-year, it jumped by 7.5%, the highest since 1982 (red in the chart below). It tracks actual rents paid by a large panel of tenants, including in rent-controlled apartments.
Other rent indices, including Zillow’s rent index, are based on “asking rents,” which are the advertised rents that landlords want to charge future tenants.
“Owner’s equivalent rent of residences” (accounts for 24.0% of total CPI) jumped by 0.6% for the month and by 6.9% year-over-year (green line). It tracks the costs of homeownership as a service, based on what a large panel of homeowners report their home would rent for.
Home prices have started falling month-to-month, according to the most recent Case-Shiller Home Price Index (purple line in the chart below), which whittled down the year-over-year gain to 13.0% (read… The Most Splendid Housing Bubbles in America: Biggest Price Drops since Housing Bust 1. Record Plunge in Seattle (-3.9%), Near-Record in San Francisco (-4.3%) & Denver. Drops Spread Across the US).
The red line represents “owner’s equivalent rent of residence.” So, given how this worked out last time, this is going to be interesting to watch unfold.
Durable goods CPI.
The CPI for durable goods fell for the second month in a row, finally, after the spikes last year and earlier this year. Year-over-year, it was still up 4.8%, down from the 18% range earlier this year.
| Durable goods | MoM | YoY |
| Used vehicles | -2.4% | 2.0% |
| Information technology (computers, smartphones, etc.) | -1.0% | -10.8% |
| Household furnishings (furniture, appliances, floor coverings, tools) | -0.8% | 7.6% |
| New vehicles | 0.4% | 8.4% |
| Sporting goods (bicycles, equipment, etc.) | 1.6% | 3.0% |
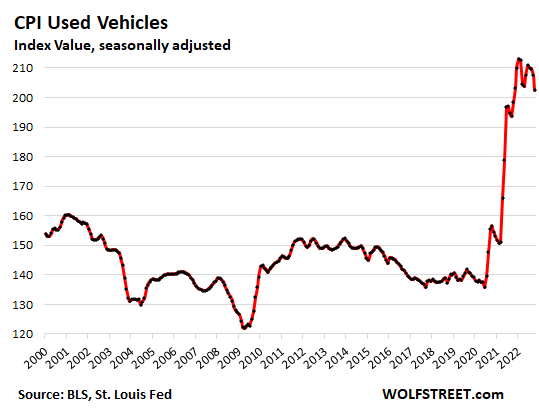
Used vehicle retail prices aren’t “plunging” or whatever.
Used vehicle retail prices barely ticked down from the ridiculous high level they’d spiked to in December 2021, and have remained largely stuck in the stratosphere, though wholesale prices are plunging:
Enjoy reading WOLF STREET and want to support it? Using ad blockers – I totally get why – but want to support the site? You can donate. I appreciate it immensely. Click on the beer and iced-tea mug to find out how:
Would you like to be notified via email when WOLF STREET publishes a new article? Sign up here.
This content was originally published here.


Responses